
How do you justify the ROI of your content marketing?
Sooner or later, especially for B2B companies, you’re going to be asked how much of an impact your content marketing efforts had on the #1 metric of all: revenue.
Lead generation is already a key objective for a majority of B2B content marketers and the trend is going up:

Source: Content Marketing Benchmarks study for 2015 and 2014 by CMI and Marketing Profs.
So how do you effectively measure the impact of your content marketing on lead generation for your company?
As marketers ourselves, we’ve spent quite some time on this question at Scoop.it and we felt it would be useful to share with you what we’ve done. We first started to use Google Analytics which is a great and powerful tool if you know how to use it. We’re also using HubSpot which has great reporting capabilities. Eventually we decided to build lead generation analytics in Scoop.it Content Director as we felt something easier and more directly connected to content was needed.
I’ll detail these various methods and their respective benefits below.
Measuring the impact of content marketing on lead generation with Google Analytics
Here’s the type of report that you can build with Google Analytics:

This reports gives us, for each of our blog posts, the number of visitors who became a lead after landing on one of these blog posts.
To build it, we’ve done the following:
-
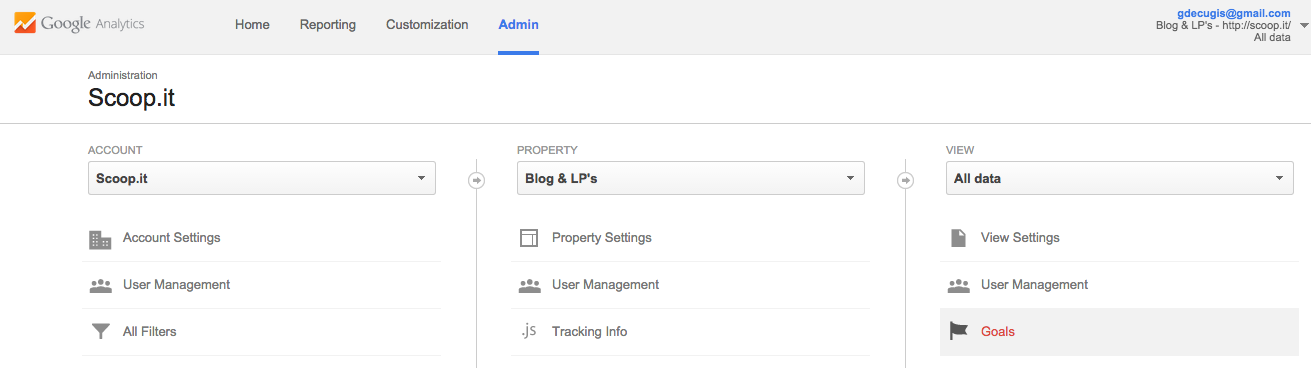
Create goals in Google Analytics
Start by defining a Google Analytics goal that corresponds to a lead conversion. For example, if you’re displaying a thank you page after a visitor has signed up to be contacted by sales, your goal would be defined as the display of this thank you page.
This support article by Google explains how to do it but it’s pretty straightforward so you can also directly go to Admin and click Goals in the View menu:
-
Go to your landing page reports

Under the Behavior > Site Content > Landing Pages.
If you have multiple goals defined on your site, make sure to select the one which corresponds to your lead generation conversions.
-
Add Source as a secondary dimension
From the drop down menu, add Source as the secondary dimension:

This will enable you to break-down leads by the way they arrived on your website.
-
Add some filters to zoom in on your blog content
If you’re using the same Google Analytics property for your entire website you may want to use a filter to zoom in on your content pages: maybe the blog subdomain or the /blog directory for your blog, for instance.
-
Bonus tip: add a shortcut
When you’re satisfied with your report, create a shortcut from the report menu so you don’t have to do steps 2-4 every time.

Advantages:
-
Free
-
Flexible: there are more reports other than this one that you can build from the Conversions menu.
Inconvenients:
-
Time to set-up: it can take some time after you’ve set up goals before they are effectively measured which makes the whole process trickier. And it’s easy to make mistakes as Google Analytics is a very sophisticated but also a very complex tool. We’re not technology-averse, far from it, but getting Google Analytics configured exactly as we wanted was still was a 2-month process. We hesitated to have a consultant help us: they had quoted us $5,000 which shows it’s not a trivial job.
-
Attribution model complexity: the above report is quite simple to build but it’s also a simple model that doesn’t capture the complexity of the funnel. It’s a first-touch attribution model per session which means that it attributes a lead to a given blog post if the visitor became a lead during a session that started on that blog post. If this same visitor lands on your homepage, visits the blog, reads a blog post that is pretty convincing then goes to check your product page and eventually become a lead, this report will not count the lead as attributed to your blog post even though it might have been critical in the process. Sure, Google Analytics lets you have other attribution models and you can go crazy with the reports but again, this is not easy to do and you might need some help in the process.
-
No individual contact data: Google Analytics doesn’t let you track visitors with individual data so you won’t be able to zoom in on a particular lead and understand what her journey was, which pages she visited, and which blog posts she read. You can see aggregated data and it will help you understand how your content performed but it won’t help you deal with a particular prospect to adapt your lead nurturing efforts or your sales efforts.
Measuring the impact of content marketing on lead generation with HubSpot
Here’s the type of reports you can build with HubSpot:

This reports shows, for each of your website’s pages, the number of people who eventually became leads after being assisted by this page.
So what does assisted mean?
HubSpot lets you choose between several attribution models as you build your report:
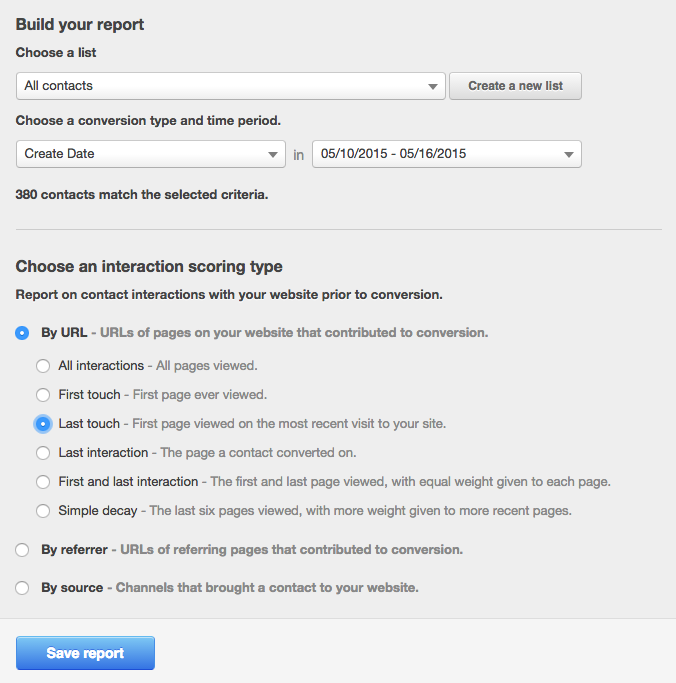
For instance, if you chose First Touch, a lead will be considered assisted by a given page if this page was the first one the lead ever viewed on your website. Note that unlike in the previous report above, this is not defined per session: HubSpot keeps track of events across sessions so if one of your visitors discovers your website on Monday, comes back on Wednesday and becomes a lead on Friday, HubSpot will show you in this model the lead attributed to the webpage visited on Monday while the Google Analytics report above will show you the webpage of the Friday visit.
Advantages:
-
Choice of attribution models: if you’ve determined a specific attribution model or if you want to analyze your content performance across several models, HubSpot has built-in attribution models ready for you.
-
Ready-made reports: HubSpot provides ready-made reports as part of what they call “recipes”. It can take a bit of time to navigate through them as there are a lot but it saves the trouble of having to configure yours if you want something simple.
-
Conversion is tracked over multiple sessions: as explained above, this is not about just measuring whether a visitor converted to become a lead during a given session. HubSpot is able to track over multiple sessions and if you so choose, you can apply an attribution model that attributes a lead to the first page ever viewed by this visitor on your website.
-
Individual contact /lead data: HubSpot can give you the entire journey of a given lead before and after she became one: which pages she visited, which forms she filled, etc… Quite interesting data.
Inconvenients:
-
Cost: attribution reports come with the Professional version of HubSpot for which detailed pricing is here. Out of the 3 options, HubSpot is the one we spend the most money on (that is, even if we were actually paying for our own Scoop.it Content Director of course…). But HubSpot is not just a way to track lead generation and the cost should be justified if you use it for landing page creation, inbound marketing and lead nurturing.
-
No easy way to zoom in on content: HubSpot is great for inbound marketing but if you’re looking to compute the ROI of your content marketing, you will want to zoom in on that and understand precisely how your blog or content hubs performed. HubSpot standard reports however mix landing pages, blog posts, site pages, etc…
-
Not that flexible: unlike Google Analytics, you won’t be able to easily customize reports to cross webpage URLs and sources, for instance.
Measuring the impact of content marketing on lead generation with Scoop.it Content Director
Here’s the lead generation report for posts within Scoop.it Content Director:

We chose to build it not just because we had grown a little frustrated with the other options but also because we felt nobody was looking at this from the point of view of a content marketer. As a content marketer, what I control is (1) the content I create or curate and (2) the distribution efforts I put into promoting it. The above report shows you that on a post-by-post basis giving you a comprehensive view of all the KPIs of your content strategy: what we’ve called the VATL model.

You need some volume of content to simply exist. This content will hopefully be shared, ie amplified by some of your readers which will result into bigger traffic, a part of which will eventually convert into leads at some point.
Of course, we’re not impartial on this but here’s how we would say this solution compared to the other 2:
Advantages:
-
Simplicity: we built the above report so you don’t have to configure anything beyond a javascript tracker (similar to Google’s or HubSpot’s). It’s just there waiting for you.
-
Content-centric: as explained above, this is your content marketing lead-generation report built by content marketers for content marketers. Just 3 numbers for each post. No distractions.
-
Conversion is tracked over multiple sessions: as for HubSpot, the Scoop.it tracker lets us go back in time so that you (or your content) still get credit for somebody who converted on Friday because she saw your awesome blog post on Tuesday.
-
A simple (but fair and powerful) attribution model: we don’t support multiple attribution models for now but that’s one less thing to worry about as we like to keep it simple. We use a simple yet powerful linear attribution which means we credit a blog post if it was viewed at any point in time before the visitor converted and became a lead. We think this is better than single touch as again, customer journeys can be very complicated (take a look at your HubSpot granular data if you use it and you’ll see customers frequently visiting dozens of pages before converting). And it also shows the value of your content throughout this journey.
- Individual / contact data (update): since the release made on 3/14/2016, Scoop.it Content Director also offers data each individual lead and contact tracked or attributed.
- Integration with email or marketing automation systems (eg: Marketo, HubSpot, MailChimp…): since the release made on 3/14/2016, Scoop.it Content Director lets you directly re-use subscription forms generated with your own lead collection system. So say you have a landing page with a form created on HubSpot to collect lead contact details before downloading a white paper. You can integrate that form with Scoop.it Content Director in order to track content impact on lead generation without installing anything else.
Inconvenients:
-
No custom reports: Scoop.it Content Director doesn’t let you create custom reports for now. But you can export the data in a CSV file which gives you some flexibility and lets you create your own reports in Excel or Google Spreadsheets.
Why now is the time to get started with measuring the impact of your content on lead generation
Beyond these 3 ways to measure content return on lead generation, there are of course additional tools available. The bottom line is that measuring content ROI from a demand generation standpoint is no longer a myth. It is now perfectly feasible to assess whether your content contributed or not to generating revenue for the company last week, last month or this year.
So while you might not be measured on lead generation KPIs yet, the time to get some practice and get started is now.
Why?
Because as simple as we made the tools to measure ROI, they’re just the diagnostic: how you should change your content strategy to generate better and more leads is the hard part. It will potentially mean changing the way you create your content, bring in new voices by leveraging contributors or add curated content to your mix. Whatever it is, it will take some time before it becomes effective.
So don’t wait.
UPDATE: once/if you’ve implemented the above, you might want to check the free content marketing analytics framework we’ve put together since this post – a simple and efficient way to break down your posts by performance and take actions accordingly to generate ROI.
Image by Matthew Hine.
Want to work smarter and start generating real results from your content marketing? Find out how to use the new Scoop.it Content Director to help you become a smarter marketer!

 (3 votes, average: 5.00 out of 5)