
As we finished 2015, I looked back at our data to find out how we’ve been doing with our own content marketing. Content marketing is fundamentally human and my first source of feedback is to be constantly listening to our audience and customers. But as a data-driven marketer and entrepreneur, I find that looking at the numbers brings a different perspective that not only helps us become better but also extracts important lessons to share with you – our mission at Scoop.it being to help you get more ROI from your content.
Overall, our numbers are up (but that’s not important: I’ll come back to that). Our average posts were shared 55% more in 2015 than in 2014. And as we did 20% more posts, this meant we nearly doubled (+86%) the number of times our content was shared. Sure, this resulted in higher traffic (15%) but for some time now and as B2B marketers, we’ve stopped looking at traffic as our main KPI to focus on lead generation.
Why?
Because content marketing is about publishing and distributing content that moves potential customers down your funnel. In other words, content marketing should be about content that converts. From that point of view, 2015 exceeded our expectations as we generated 20,000+ leads through our content – 6x more than in 2014.
So this post is about what we learned from these 20,000+ leads our content contributed to helping generate and how you can look at your own content marketing analytics to find similar insights. Specifically:
- What key performance metric to focus on.
- Why and how to look at performance on a post by post basis.
- Our simple framework for content marketing analytics.
- Actions you can take now to help you better understand what works and what doesn’t
Why your content marketing analytics KPI (Key Performance Indicator) should be lead generation
Before we look at the data, let me come back to why traffic (or shares or attention, etc…) – while useful – is not the perfect content marketing analytics metric for B2B marketers.
What is the point of content that doesn’t convert?
I’ve heard many arguments about this. Some will argue that top of the funnel content cannot convert. Or that content can still be useful for brand awareness even if it doesn’t convert well. Maybe… But I’m an engineer-turned-marketer who prefers facts over maybes. So I believe there’s another way to look at this. I believe every piece of content should convert provided you offer the right call to action. Sure, a first-time visitor won’t be likely to click on “talk to sales” immediately after reading a high-level thought leadership piece from your blog. But would you be able to say that this piece of content was awesome even if nobody subscribed to your email list to receive more similar content? Or if nobody bothered to download a gated white paper expanding on this topic?
No.
In a recent post where he compares the key ingredients of successful content marketing to layers in an ice cream sandwich, Bernie Borges, the founder of the Find and Convert agency, makes the point that “each piece of content published should be (1) authentic, (2) relevant and (3) actionable”. On that last point, he adds: “The most important responsibility of the marketing team is to make stories actionable – stories so meaningful that the consumer wants to take an action.”
Julia McCoy gave me a great example of such a desired action: a reader of one of her guest posts ended up purchasing more than $5,000 worth of services from her site after reading one of her posts. The reason? “Your content was so informative and good, I had to come to your site and try out your writing service“, the reader told her team.
 One way to encourage such conversions and build on the momentum you create with your reader is to offer calls-to-action (CTAs) in your content. These CTAs need to make sense and be aligned with your content’s funnel stage: if you’re writing for top-of-the-funnel first time visitors, don’t rush your readers to talk to sales; instead, invite them to subscribe to your newsletter or download an ebook. In other words, “don’t be blatant” as Julia put it when we shared on this topic. And, while I’d still recommend adding CTAs to make things easy for your readers and guide them to the most logical conversion, she also noted that the post mentioned above which generated $5,000 in sales didn’t even have a CTA as it was a guest post.
So long story short, good content should convert – maybe not always by converting visitors directly into customers but at least into subscribers or contacts. So focusing on conversions is your best way to not just create ROI for your content efforts but also measure this ROI and make your content marketing analytics a lot simpler by focusing on one metric.
 |
“The challenge for every content marketer is to envision the needs and questions of visitors beforehand and create content that answers those questions in a logical progression. An artfully constructed web of blog posts, digital downloads, emails and landing pages will offer visitors the information they’re looking for, facilitated by strong CTAs where appropriate. In other words, create the paths, and then lead your visitors down the best path for them at any given moment.” – Mike Allton – CMO, SiteSell |
Totals don’t help you improve: why you should track content marketing analytics on a post by post basis
While we’re happy about the above results, the key for us as content marketers and what I want to share in this post is: how can we learn about what worked and what didn’t so we can do even better in 2016?
As I mentioned before, content marketers need to have performance metrics such as traffic and leads not just on an overall basis but post by post. Dealing with average or total stats doesn’t tell you where you failed and where you succeeded. To learn that, you need to understand each piece of content’s performance.
By using our own Scoop.it Content Director analytics, we’re able to extract that data easily by going to the Analytics tab and then using the Posts view:
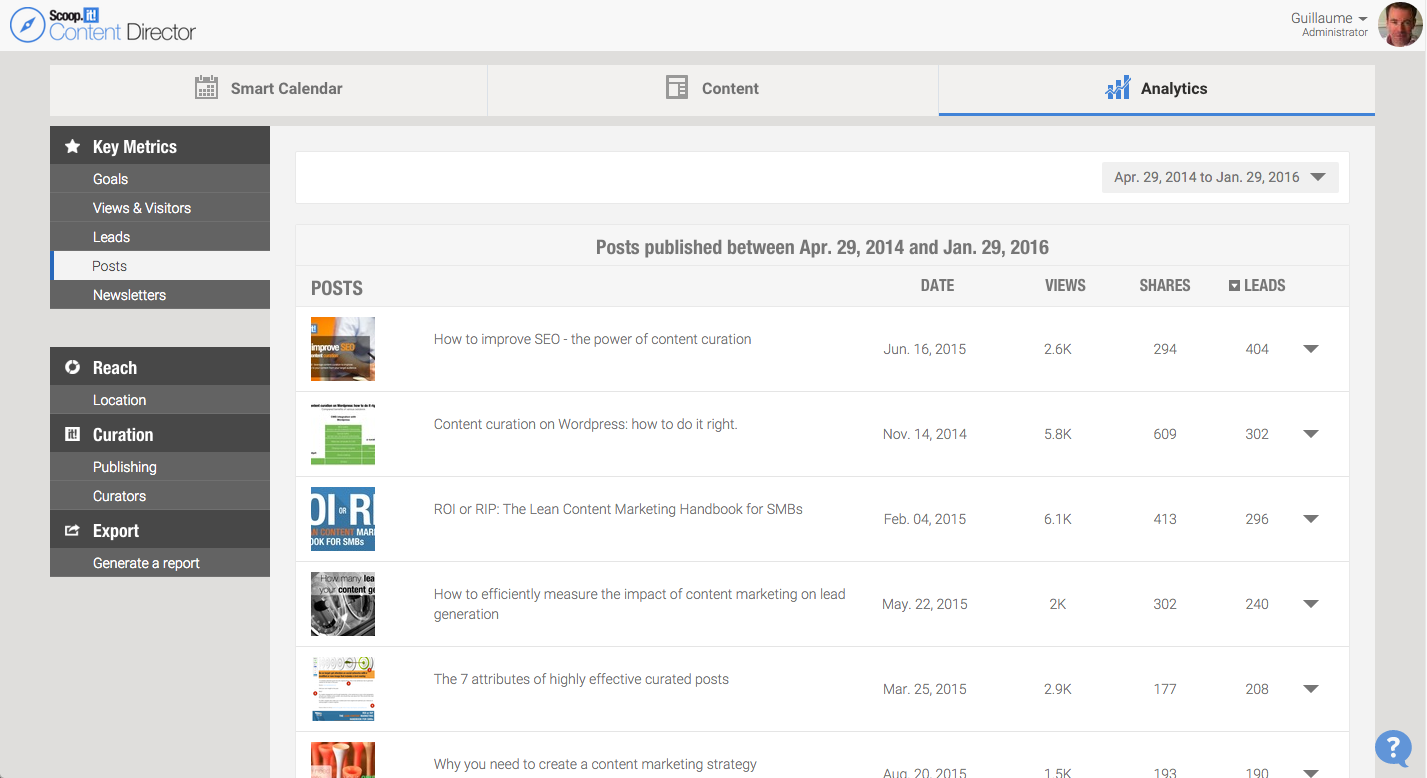
And we can then perform some analysis to compare how posts differ by their impact on our main KPIs.
A simple content marketing analytics framework for B2B marketers: looking at lead conversion rates vs traffic
 |
“The majority of companies that publish content are content publishers not content marketers. The content publisher is happy when content is published, the content marketer looks for leads. This framework will help companies identify what’s working and not working and help us focus on ‘content marketing’.” – Ian Cleary – Founder, RazorSocial |
When you stop considering content success through the sole prism of traffic but look at generated leads – a much more important KPI for your business – things can change completely. Of course, you’ll find an overall correlation between traffic and leads. But again overall stats mean very little if you’re looking for actionable recommendations.
To make things really simple, one of the greatest pieces of advice I’ve heard on content marketing ROI was from Andy Crestodina who recommends looking at conversion rates for each piece of content. Your conversion rate is the number of leads generated by a given piece of content divided by the number of views. It’s even better than absolute lead number per post as it both captures lead generation and gives you a great measure of efficiency.
To do that you need first to ensure that you have a system to not just measure generated leads but attribute them to content. There are various attribution models that can be set up and configured: this post is a step-by-step guide on how to do it with Google Analytics, HubSpot or with our own Scoop.it Content Director. In the results below, we credit a blog post if it was seen by the visitor in the previous 30 days before he/she became a lead. Note that it means that the total number of attributions is greater than the number of leads as a lead can be attributed several times but the important point is that this model helps surface significant differences between various posts.
When you derive the conversion rates from the measured leads and page views, the interesting observations you’ll make will be:
- Your conversion rate can greatly vary from one post to another. Because of the nature of your content but also because of conversion rate optimization questions or simply because of the choice of your CTA (again, rushing first time visitors to talk to sales is like saying “I love you” on a first date: it freaks people out).
- Consequently, your most viewed posts are not necessarily your most revenue-generating ones.
Here is our own 2015 blog post distribution by conversion rate and traffic:
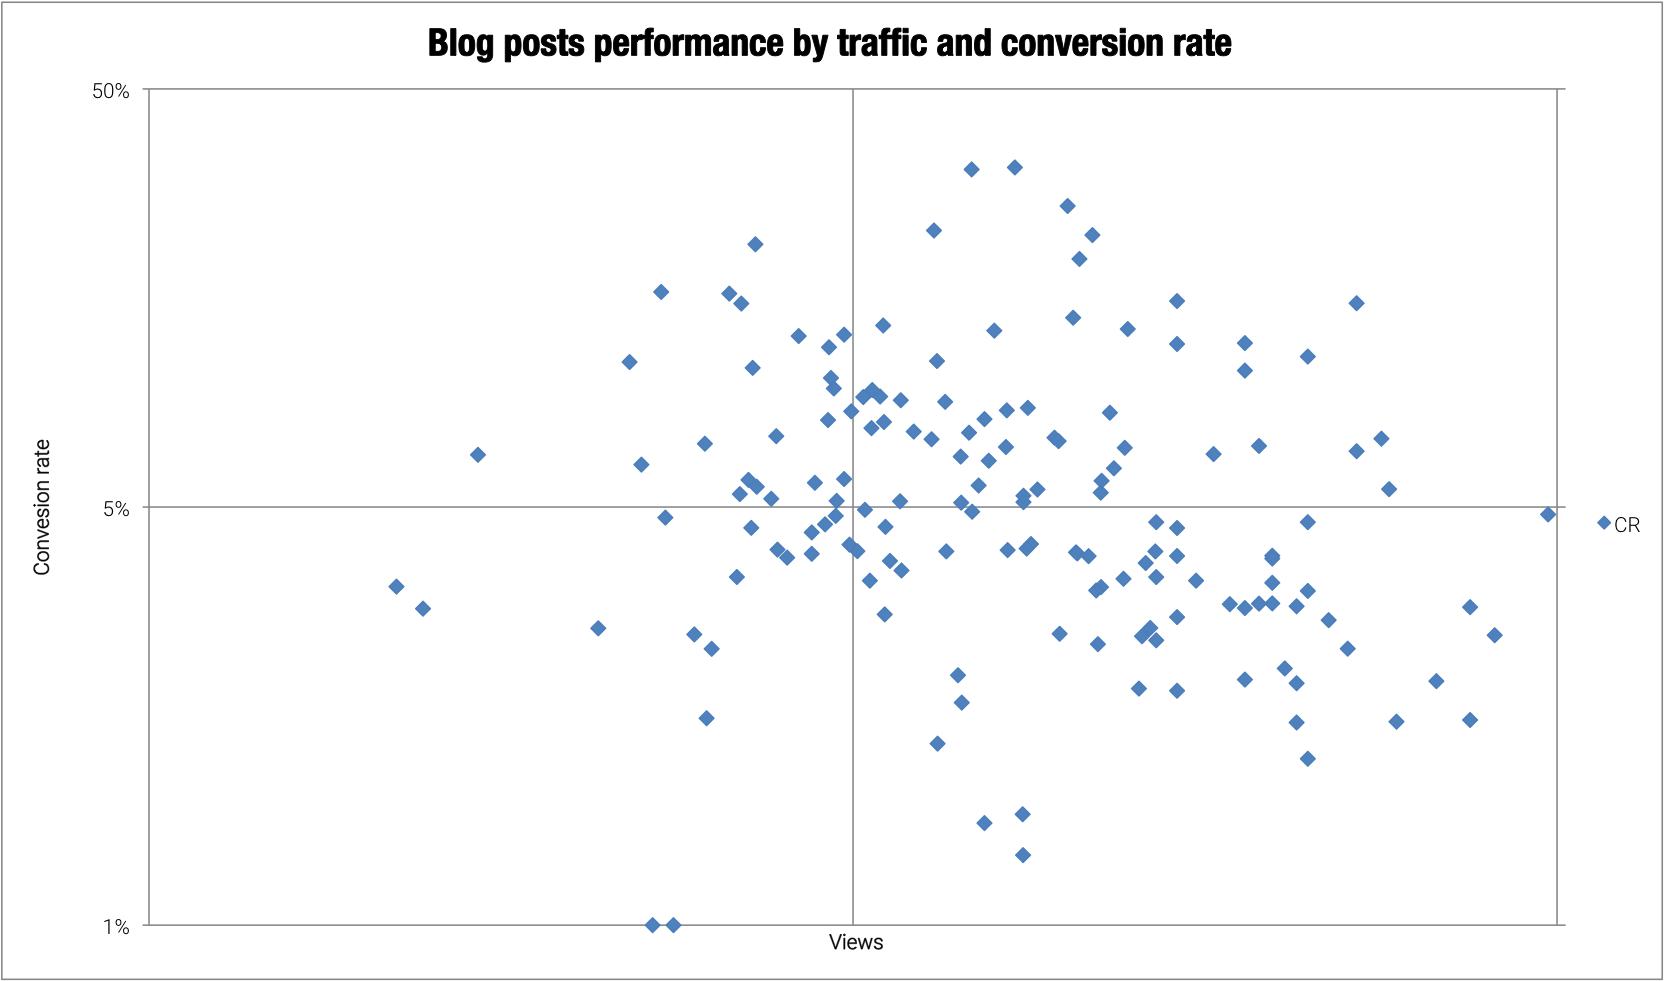
Pretty much all over the place, right? Clearly not all content is performing equally.
The way I like to look at this is by turning this into a matrix by adding split lines in the middle of each axis (which are using a logarithmic scale):
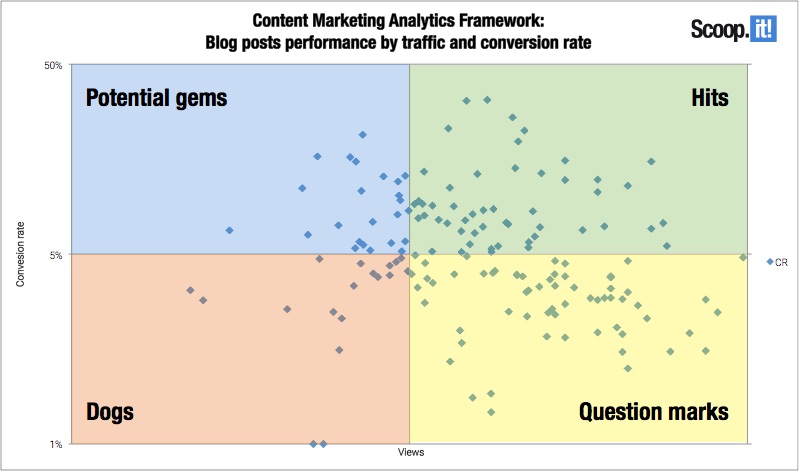
Inspired by the BCG matrix that I remember from the few business school classes I took, I can then classify our content into 4 buckets:
- Hits: posts in the upper right side of this chart are highly converting posts which generated high traffic. These are our content marketing hits. In an ideal world, you’d be doing just that of course. So look at what they have in common, who wrote them, how you promoted them and try to do it again because that’s what your audience wants. And of course, don’t stop promoting them: re-share those that are evergreen content and update the others so you can continue promoting them in the future.
- Dogs: in the lower left of this chart are low converting posts with low generated traffic. Ok, you might want to quickly forget about those but don’t: try also to understand what they have in common and how they differ from hits. What does it tell you about your audience and what they’re interested in?
- Potential gems: in the upper left are high converting posts which generated low traffic. Are these posts too self-promotional? Or could this be a promotion problem? If it’s the former then you might not be doing content marketing but advertorial – the difference being in the value you add from your audience’s – not your own – point of view. But maybe it’s just that you haven’t promoted these posts the way they should: giving them a second chance by re-sharing them over your social calendar could generate good results. Be careful though: when numbers get small, it’s easy to have a conversion rate which goes high but without being significant so this second chance should only be given to posts which have shown conversion rates on some traffic (rule of thumb: at least 10-20 conversions).
- Question marks: last, in the lower right, are what you might have considered so far to be your most successful content but you now know where I’m going with this. Sure, these posts generated traffic but you don’t get paid in views… Should you stop creating that kind of content? Maybe not. Look at these posts again: do they have CTAs to start with? Don’t feel ashamed if they don’t: 48% of content marketers admit to be like you and forget to add CTAs to their content. Simply update your posts to add them. If you did include CTAs then maybe they’re not aligned with the post’s content. Again, try to understand which stage of your funnel readers are in when they read your post. Find a better corresponding CTA if you can. If you can’t, it probably means this post was generating the wrong kind of audience for your business goals.
 |
“A lot of marketers measuring things like email vs social and facebook vs. Twitter. But the best marketers go deeper. If you check the performance of specific types of content, you can start making much better decisions about what to blog about. Now you’re one step closer to learning what your readers love most. I highly recommend this level of analysis.“ – Andy Crestodina – Co-Founder, OrbitMedia |
How much of your content is really efficient
When you classify your posts this way, you can then create a simple contribution graph like this:
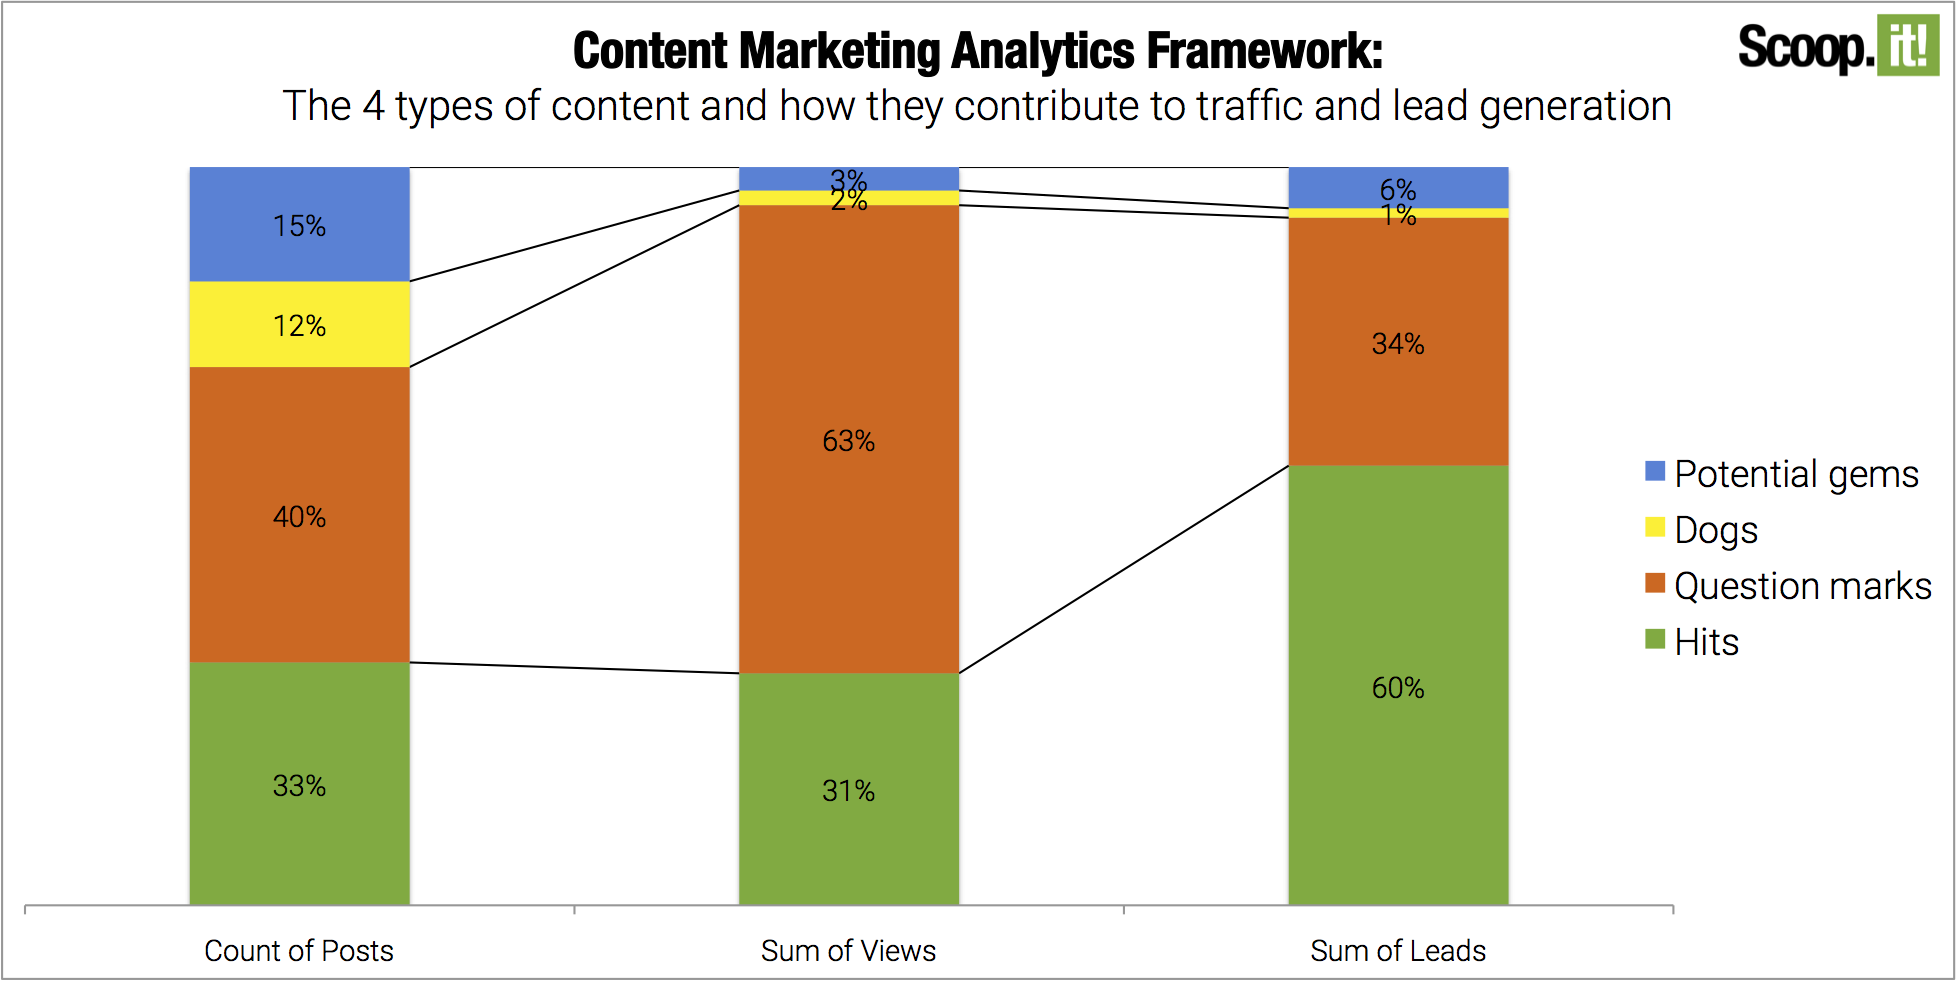
Conclusions are now easy to make. In our case:
33% of our 2015 posts were hits and though they did about the same share of total traffic, they contributed to 60% of our leads. You can definitely expect us to keep rotating them on our social channels and link back to them from our upcoming blog posts. Examples of such posts include:
- How-to guides such as “How to efficiently measure the impact of content marketing on lead generation”;
- Educational infographics such as “The 7 attributes of highly effective curated posts”;
- Round-up of best practices such as “12 signs you’re wasting time on content marketing”;
- Data-driven case studies such as “Content Marketing ROI: Do eBooks and White Papers Generate More Leads Than Blogs? A Data-Driven Answer”;
- Note that some of these hits are original and others are curated posts such as “Content curation and website traffic: study finds 464% growth in 4 months”.
40% of our 2015 posts were question marks, and thus need some work: they did great in traffic but they haven’t completely shown the money yet. We’ll revise their CTA and perform some upgrades to try to improve their conversion rates. Candidates for this include:
- This awesome guide by Julie that was widely shared and that explains “How to write good blog posts for your audience and SEO and make sure they perform” that probably deserves a more aligned CTA;
- The great infographic on new SEO rules that I curated as “A simple SEO guide in 2015 (Infographic)” and for which I’m going to upgrade by re-writing the insight to better articulate what this means from a practical standpoint.
12% of our 2015 posts are dogs: we’ll try to learn the lesson. For instance, in this post on high-level content marketing predictions, I probably failed to articulate any concrete take-away for practical marketers.
15% of our 2015 posts might be hidden gems: we’ll give a second chance to the most promising ones by re-sharing them. Some we’ll focus on include:
- “The best content marketing tools for the measuring phase (6/6)”, the last one of our series on content marketing tools for each phase of the content marketing cycle. It’s under-read but it has an impressive 21% conversion rate and all of the posts in this series were hits except this one. Clearly deserving posts, right?
- “Content Marketing ROI: how to define, measure and improve content effectiveness” which is an evergreen guide that delivers a 13% conversion rate and that could very well fit in our resource center for extra visibility.
This exercise might look complex but with the right analytics tools, it becomes very easy to perform on a quarterly or even a monthly basis. You can take the guesswork out of your content marketing and measure the real ROI of your content marketing beyond simply looking at traffic. And of course, you can refine the system by looking at additional metrics such as conversion paths:
 |
“Measuring content performance through this framework totally makes sense. In addition, it is very helpful to know which article served as the landing page, to understand which type of content attracts converting traffic and also which articles participated in the process. It helps determine better references in the “related stories” and “read next” sections, thus increasing the overall conversion rate of content.” – Ron Sela – Content Marketing Strategist, RonSela.com |
As a next step, as Ron and Ian also suggested, we’ll look at how content helps nurture these leads into customers. And see if we can define content impact not just on leads but also on pipeline (opportunities) and sales.
Conclusion
If you want to succeed, you have to take a step back and look at the big picture of the full content marketing lifecycle. By leveraging technology and content marketing intelligence, you can optimize your efforts in every phase to ensure you reach your goals. And deadlines.
Want to work smarter and start generating real results from your content marketing? Find out how to use the new Scoop.it Content Director to help you become a smarter marketer!


 (28 votes, average: 1.61 out of 5)
Staying in touch with this topic is like drinking from a fire hose. However, in my experience, much of the advice I read on KPI fails to offer insight into how best to build leads for small firms in niche markets who are just getting started. Being able to pinpoint the best KPI presumes that a firm has been going to market and has compiled enough contacts to at least exploit Mail Chimp-style email marketing. But what should we do if the contact data base is really small? Scoop.it rises to the occasion, in my opinion, through social network marketing… Read more »
Great point @M@murryshohat:disqus – The bootstrap question is a very interesting one indeed. It would be worth a full post but I believe outreach (to influencers, potential customers, partners…) plays a key role for startups or companies just getting started. In addition to helping getting distribution, outreach also provides great validation (or lack of) for your content. Maybe we should work on a post on “how to bootstrap your content marketing strategy” then?
You could set the standard and gain fame if you have a strong strategy, Guillaume. Many new Internet businesses start with literally less than 100 contacts. Some think that SEO alone will make them successful overnight by some magic they don’t understand. Unlike a fool, I don’t rush in with promises. Patience is my first lecture and I have to repeat it often. No matter how well we hook up the marketing automation and promote promote promote, it takes time to conduct outreach, build an audience and begin to reap inbound clicks that convert. I welcome “Guillaume boostrap magic” to… Read more »
Patience indeed is a virtue… But good topic: I’ll think about a post on this content marketing bootstrap. There are definitely some lessons learned worth sharing and maybe you’d want to contribute a couple of your own, @murryshohat:disqus ?