Are you a data-driven content marketer? I hope so. There isn’t much margin for error in a world of content shock, murky ROI and limited time and budgets. Why not use every edge you can get?
Even if you are devoutly data-driven, it’s good to know how other marketers’ data looks, too. To help you compare your results to theirs, I’ve rounded up the 5 best Content Marketing reports of 2015.
Oh – and these studies might help you map out what to do for 2016, too.
1. The Content Marketing Institute and Marketing Profs’ B2B and B2C Content Marketing Benchmarks, Budgets and Trends – North America reports.
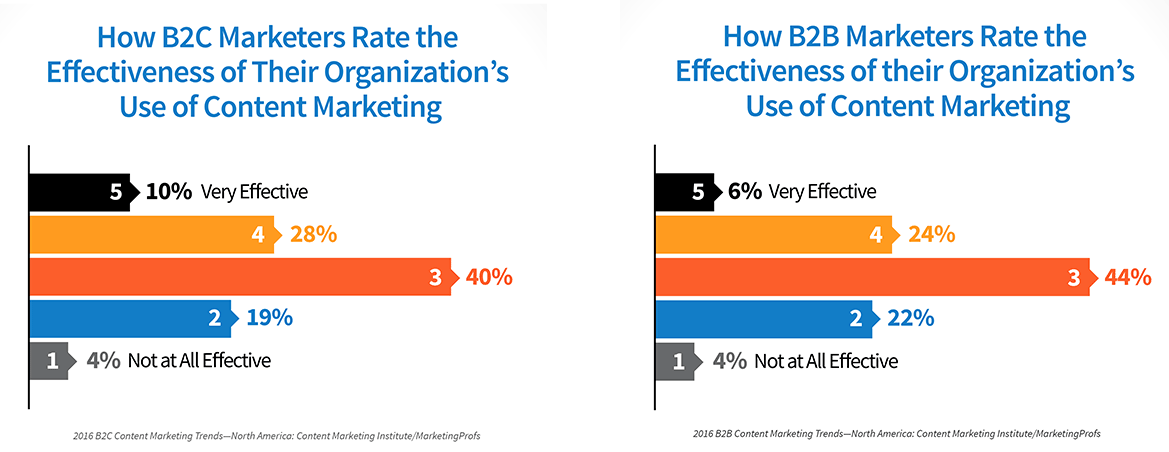
Bad news first: Most content marketers struggle. Only 30% of B2B content marketers and 38% of B2C content marketers say they are effective.
Here’s CMI and Marketing Profs’ explanation of this chart: “For this survey, we define effectiveness as ‘accomplishing your overall objectives.’ We refer to those who rate their organizations as a 4 or 5 (on a scale of 1 to 5, with 5 being ‘Very Effective’ and 1 being ‘Not at All Effective’) as the ‘most effective’ or ‘best-in-class’ marketers. The 1s and 2s are considered the ‘least effective,’ while the 3s are neutral.”
B2B marketers seem to be having a particularly hard time. Last year, 38% of them said their content marketing was effective. This year, it’s only 30%. Could content shock be taking its toll? Or maybe some investments in new tactics just didn’t pan out.
Part of the problem is many of us aren’t sure what we’re aiming for. Only 44% of B2Bers and 43% of B2Cers are “clear what an effective or successful content marketing program looks like.” It’s really hard to be effective if you haven’t defined what that is.
If you’re struggling with this same problem, read our ebook ROI or RIP: The Lean Content Marketing Handbook for SMBs. It’s got recommendations from sixteen of the top content marketers in the world for how to define goals, track ROI, and execute the tactics that work most often.
There is plenty of good news, too. Here are some factors that can improve your odds, according to the report:
- Have a documented (i.e., written out) content marketing plan
- Have a document editorial statement
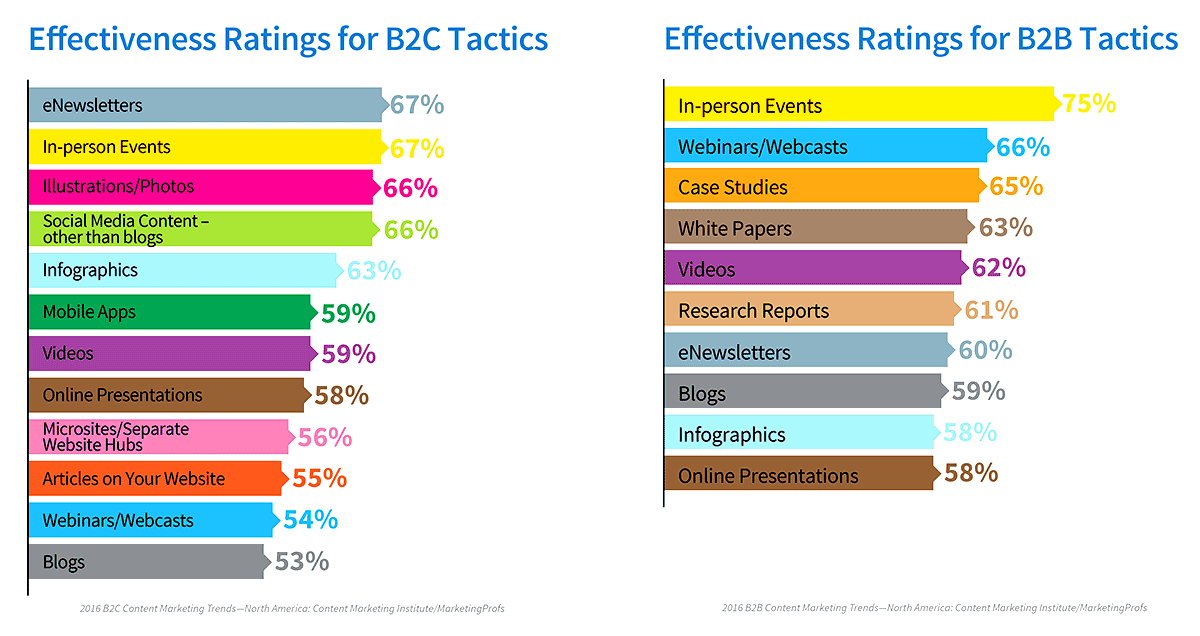
- Use the most effective tactics from the charts below:
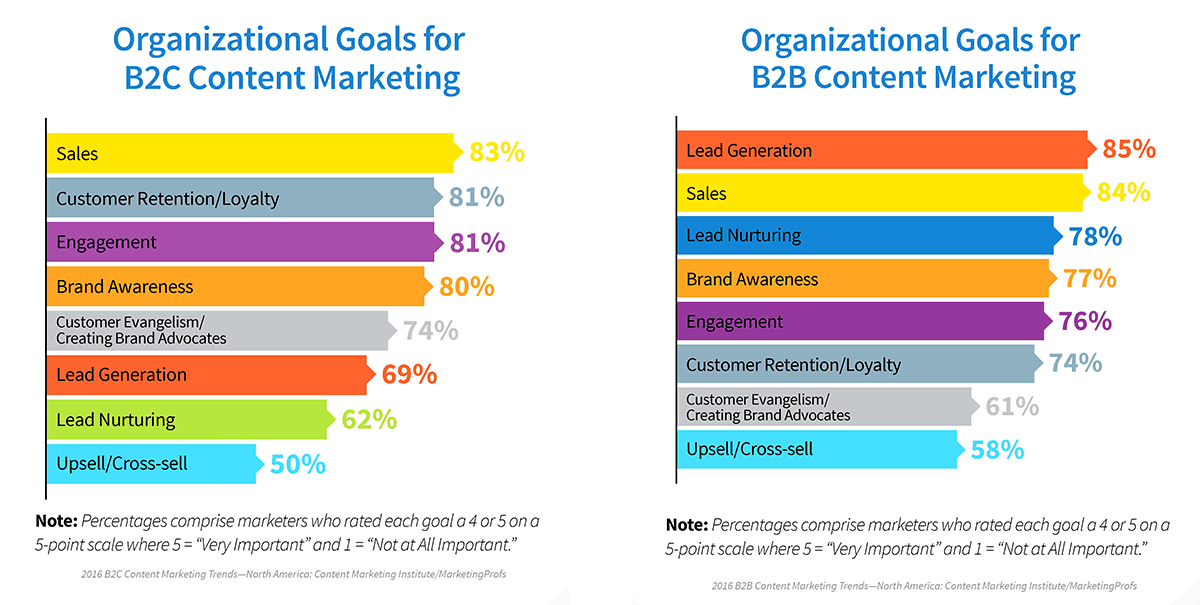
Despite the struggles, marketers are moving forward. They’re making larger commitments to content marketing. Most of them (76% of B2Bers and 77% of B2Cers) will be making more content in 2016. And half of them will increase spending. Here’s what they hope that spending will achieve:
2. Social Media Examiner’s 2015 Social Media Marketing Industry Report
This report from one of the premiere social media blogs is a must-read for any content marketer. It is entirely focused on social media, but for most of us, social media is a core component of content marketing.
So what’s the story here? Social media ROI is about as elusive as effectiveness is for content marketing. Only 42% of the 3,700 marketers who participated in the survey say they can track the profitability of their social media work. But again, despite those challenges, most marketers will invest in more social media work going forward. 66% of social media marketers plan to spend more time on social media.
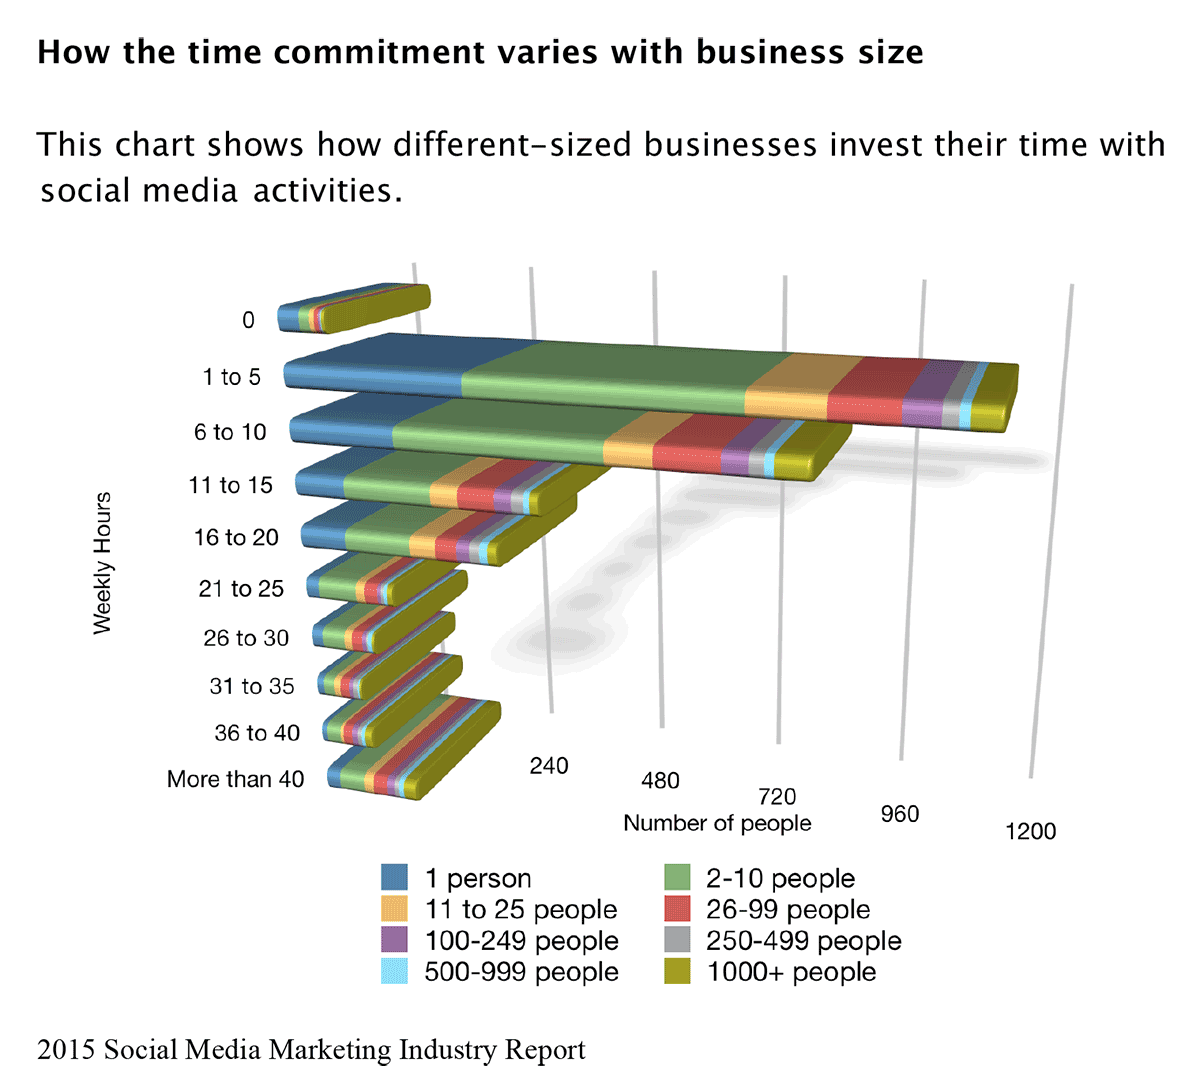
My favorite chart from this study is where they break out how much time people spend doing social media based on their company size. Everybody wants to save time on social media, so it’s helpful to see how much time people tend to spend.
Social media is also synonymous with blogging. 45% of marketers said their most important form of content for their business is blogging.
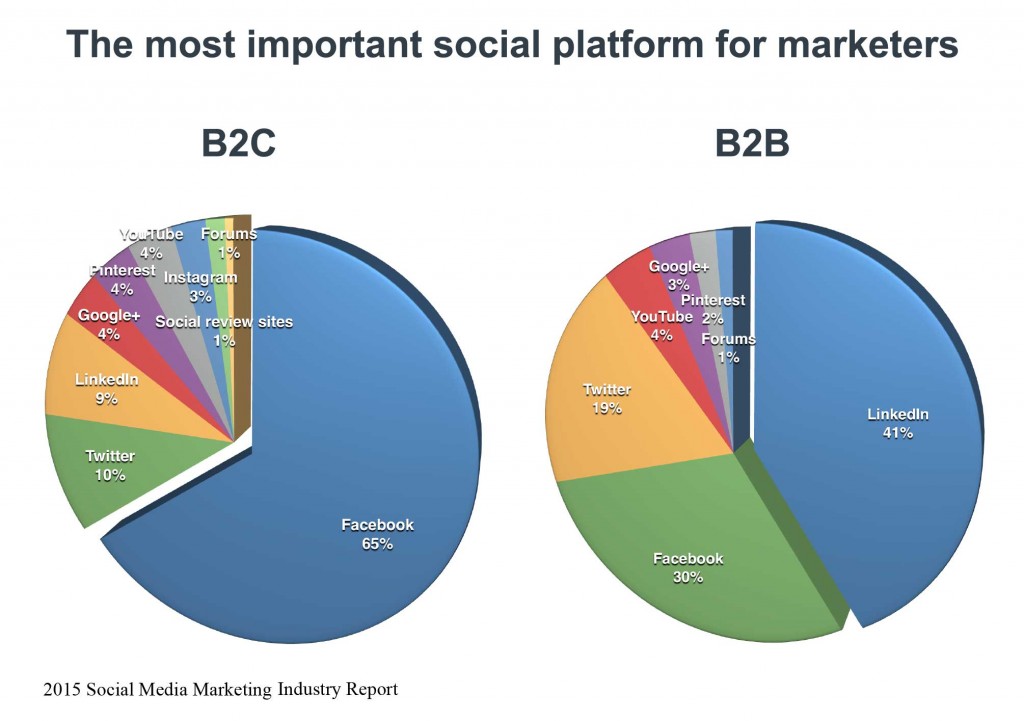
What about the most important social platforms? Not too surprisingly, the primary platform for B2C marketers is Facebook. The primary platform for B2Bers is LinkedIn.
Another really interesting takeaway: Less than half of marketers – 45% – said their Facebook efforts are working. The rest either don’t know, or say Facebook is not turning a profit for them. That’s disheartening, but consistent with other reports. Want to be in the group that is seeing results? Read Guillaume Decugis’s post, Increase Facebook reach without paying for advertising.
3. BuzzSumo and Moz’s study, Content, Shares and Links: What We Learnt From 1m Posts.
This study rolled out just a few months ago. Some of the findings from it are whoppers, especially in relation to content sharing.
Here are few of the key takeaways:
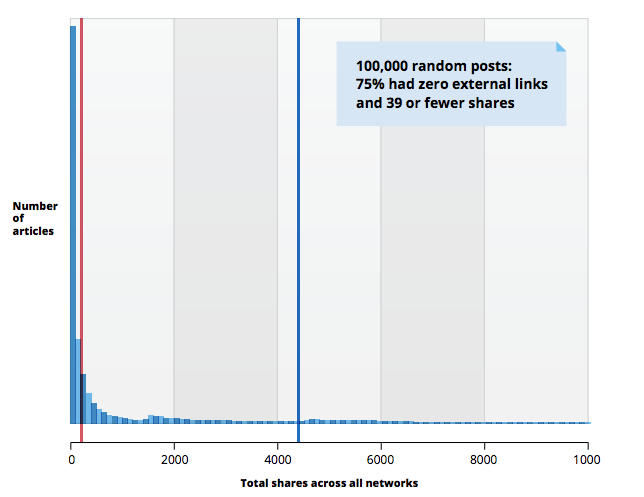
- 50% of all posts get 8 shares or less.
- 75% of posts generate no inbound links
- There is no correlation between shares and links. What causes people to share a post appear to be different than what causes them to link to it.
- Some content types and formats get significantly more shares and links:
- Long content performs best: “content of over 1,000 words consistently receives more shares and links than shorter form content.”
- Research-backed content and opinion-forming journalism get shared and linked to the most.
- “Formats such as entertainment videos and quizzes are far more likely to be shared than linked to. Some quizzes and videos get hundreds of thousands of shares but no links.”
4) Hubspot’s State of Inbound 2015.
This one’s so comprehensive, they offer two versions: One for sales and one for marketing. I suppose when you’re surveying 3,957 marketers and sales people, you might as well go big.
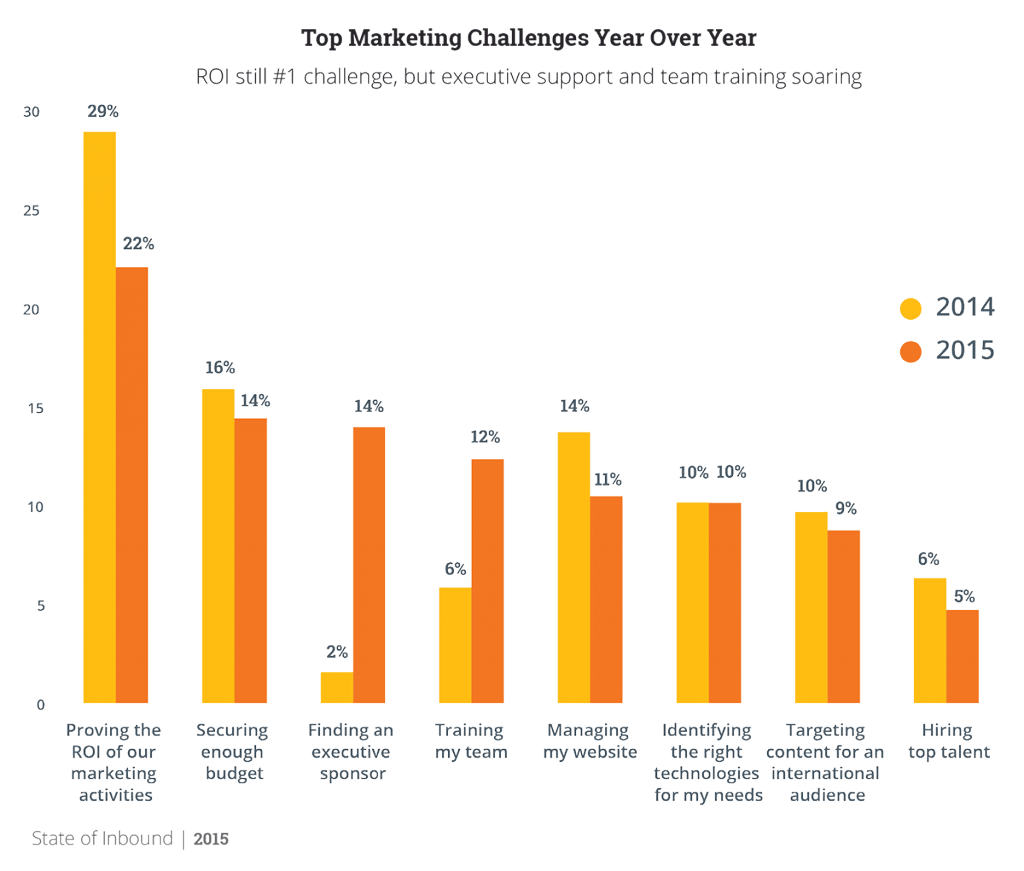
And big it is. The report covers nearly every aspect of what marketers struggle with, want, and how they try to get what they want. Not too surprisingly, one of the key charts in the study names a common foe: Proving ROI.
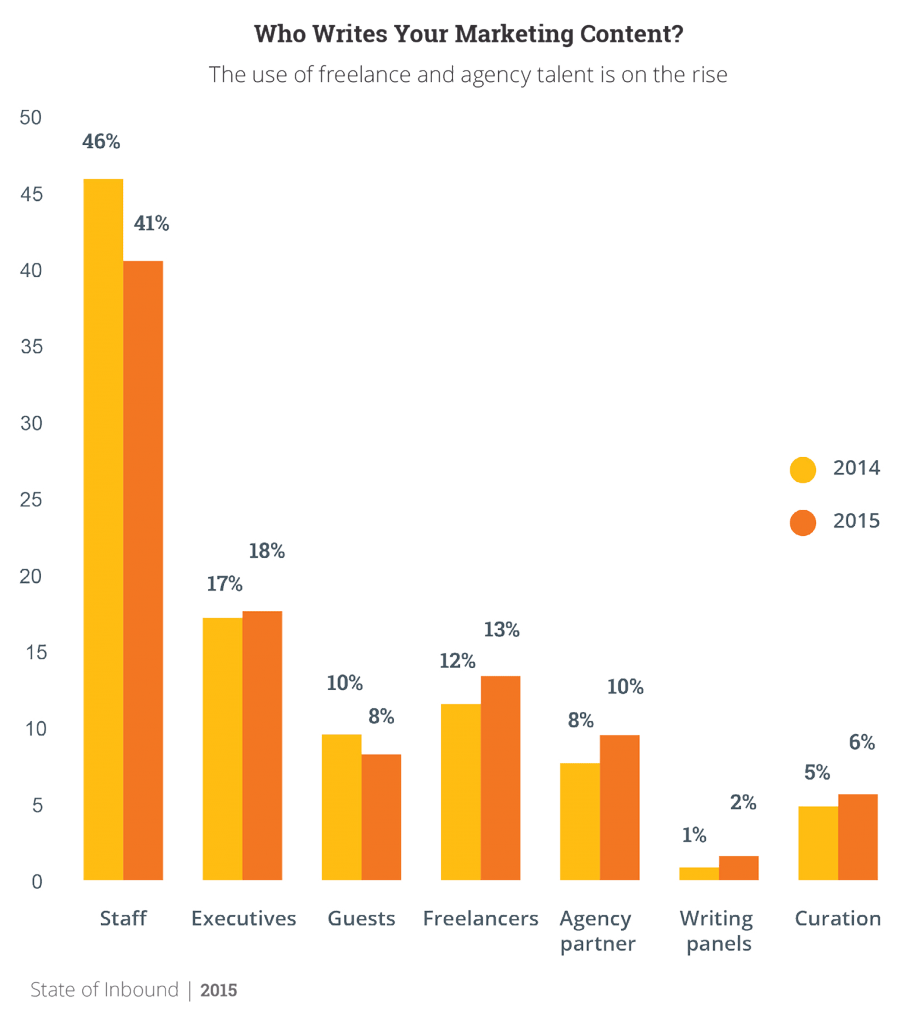
The report also tracks the “most overrated tactics”, and makes the case that inbound is profitable for all types and sizes of businesses. It’s also one of the few content marketing studies to include curation as a source of content creation. We were happy to see the percentage of marketers who are using curation has ticked up this year. But with only 6% of marketers curating, there’s still abundant room for more curation.
5) The SalesForce/Marketing Cloud 2015 State of Marketing.
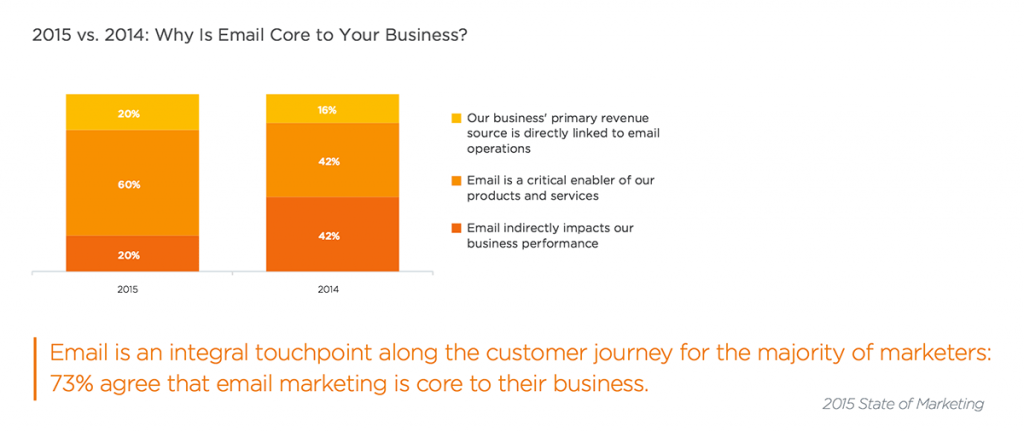
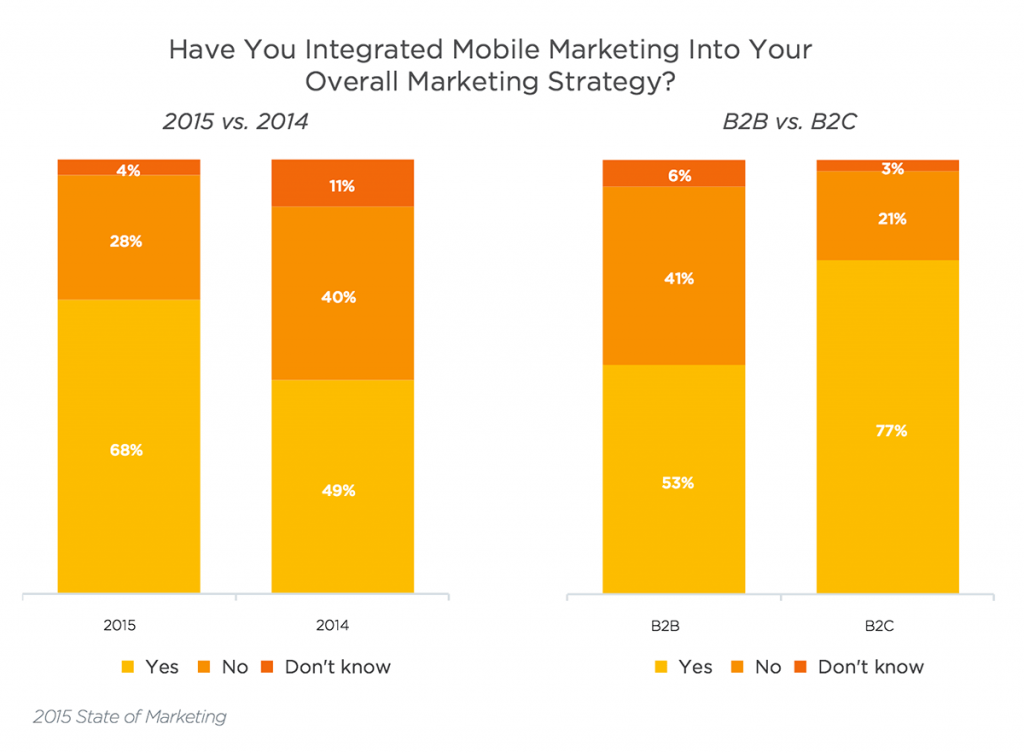
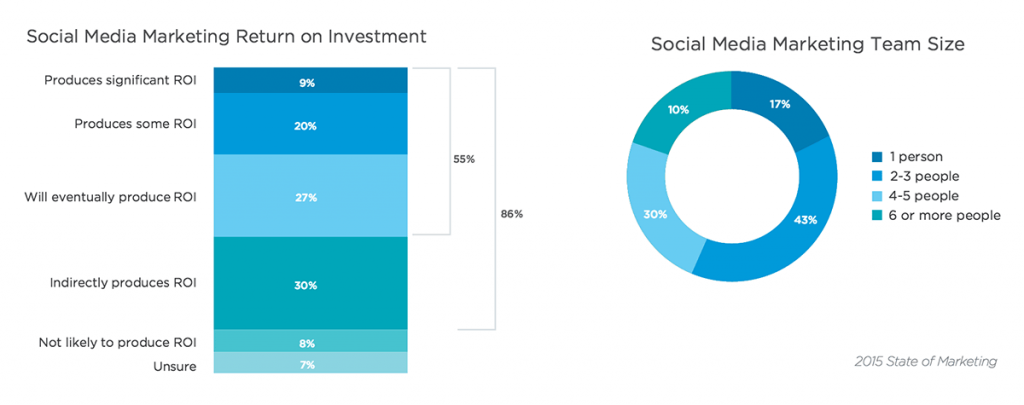
This is another study that’s vast in both the issues it covers, and in how many people participated. 5,000 marketers from around the world gave their input to the study. This is also one of the few studies that gives details on email, mobile and social marketing. It also breaks the results out by country. So if you’re doing global marketing, this is a must-read.
Here are a few of the most interesting charts from the study:
- Email has become significantly more important to these marketers in the last year.
- So has mobile:
- Social media fared unusually well in this study. Most marketers said they get at least indirect ROI from the channel. But note how the social media teams are, on average, larger than the ones in the businesses Social Media Examiner In that study, SME included social media results from entire companies made up of 1-10 people. In the SalesForce study, they’re looking at social media teams of 1-10 people.
Honorable Mentions
It was tough to limit this to only five reports. These other content marketing reports might not be as comprehensive as the five listed above (at least in terms of survey size and how many charts they have), but they have valuable insights all content marketers should know. If you’ve got time, read these too.
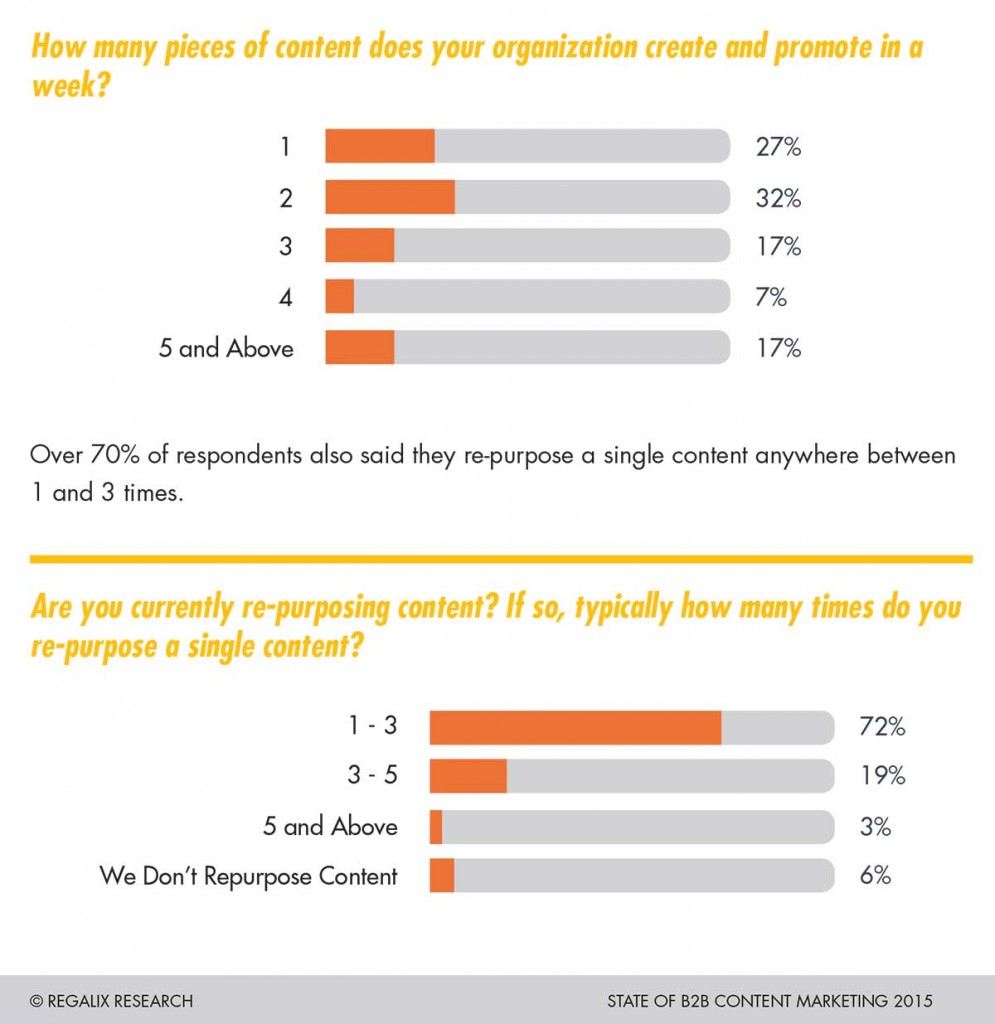
1. Regalix’s 2015 State of B2B Content Marketing.
This survey has all the usual charts: Budgets, which tactics are used, challenges, best practices, ROI and more. It also breaks out twenty-three different content formats in terms of how they perform at different stages of the sales cycle. And it shows how much content marketers are creating every week, and how often they repurpose that content.
2. Visually and percolate’s Content Marketing Reimagined: How Brands Can Earn Attention in 2016.
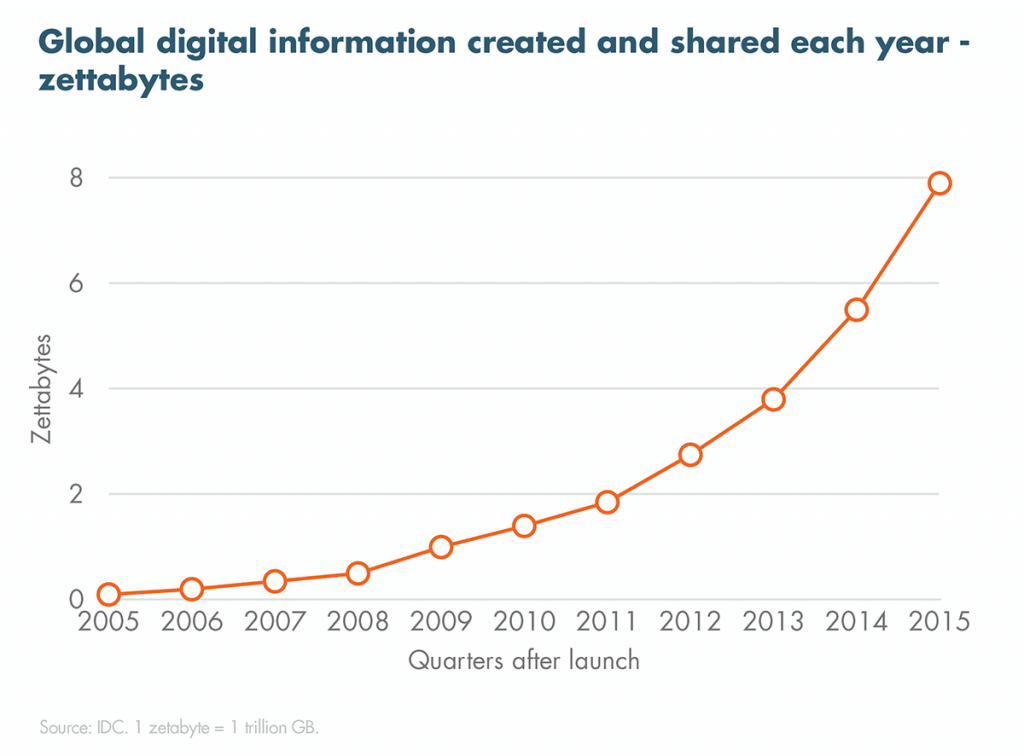
Good information here about how much content is being created year over year, and about how people are consuming that content. This report also has very interesting mobile and social charts, plus research on the points of friction between marketers and creatives.
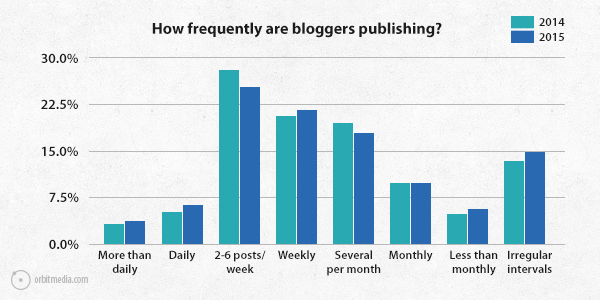
3. Orbit Media Studios’ survey of 1,000 bloggers.
Want to see how your blogging measures up? This survey has details on time spent per post, word count, and other important blogging details.
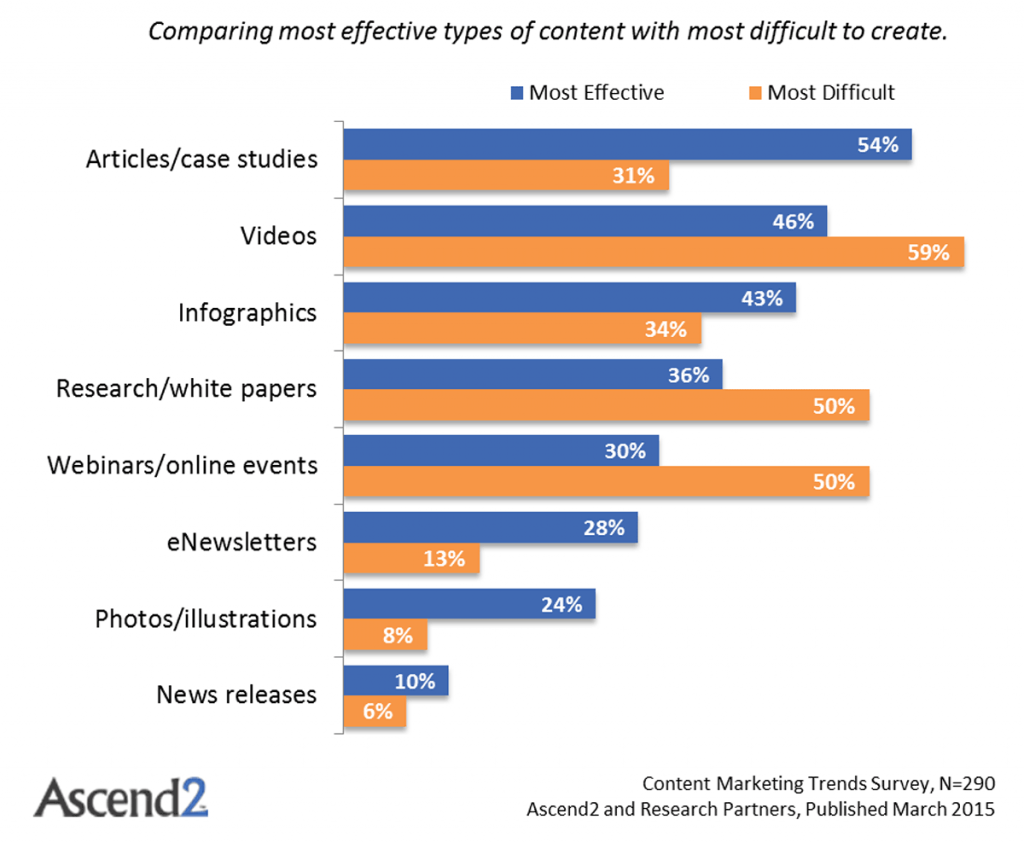
4. Ascend2’s Content Marketing Trends Report.
The easiest way to access the report is to register with Ascend2, then scroll down their list of research studies. Once you’ve found it, this study will walk you through the typical charts of budgets, goals, and challenges. My favorite chart here is where they compare the most difficult content marketing strategies with the most effective.
Did we miss your favorite?
Got a favorite report I didn’t include here? Got a beef with any of these studies? We want to hear from you. Please share your insights in the comments.




Great report. Thanks.
Glad you liked it, Alvin. Thanks for your comment.