
In a survey last year of more than 1,500 professionals using content curation, 76% of them said content curation helped them reach their business goals. As content becomes more and more important to achieve success, it also becomes critical to measure how it effectively helps. In fact, as renowned businessman & author Peter Drucker put it, “If you can’t measure it, you can’t improve it.”
Having data is is one thing, but being able to analyze it is a completely different ballgame. Data needs to be visual in order to have an impact and guide future actions, and that is why we have created a beautiful new interactive Analytics center within Scoop.it. We’ve taken into consideration some of the most important data points that guide content marketing strategies, including whether or not content resonates with an audience, times of day the audience is online, and work division between team members, and based our redesign off of them.
The bottom line is that today, we’re excited to announce a complete revamp of our analytics dashboard bringing not only better looking, easier to use analytics but also new metrics and KPI’s to better understand the impact of your content curation.
A complete redesign

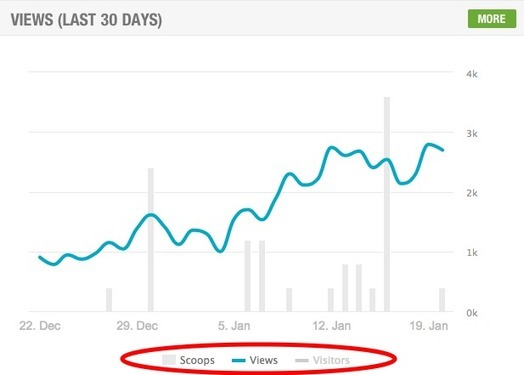
Good looking data is easier to understand. The new Scoop.it analytics have been completely redesigned with gorgeous interactive charts.
Mouse over a graph to get details in the tool tip:


Select / deselect metrics by clicking on their label in the graph legend:
New Metrics and KPIs
The new Scoop.it analytics are not just beautiful; they’re also smart.
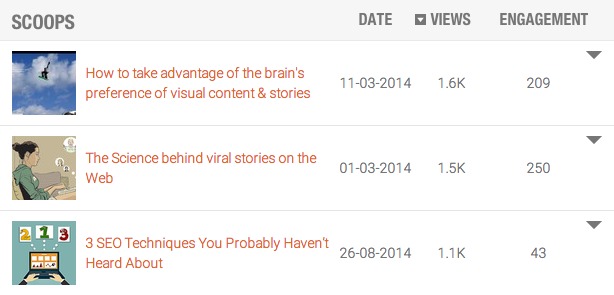
While they’ll of course give you everything you were used to in the previous version (audience metrics, performance by scoops, most engaged users, etc…), they add new KPIs that will help you take your content curation efforts even further:
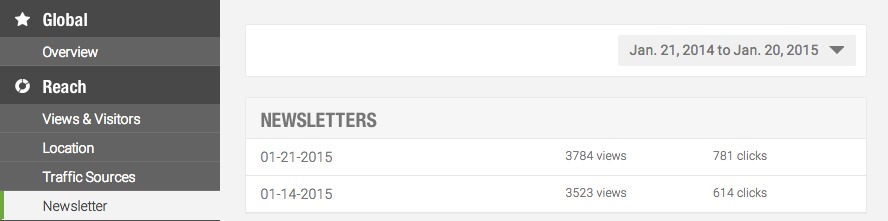
- Newsletter analytics: track the opens and clicks of your curated content newsletter directly from Scoop.it.
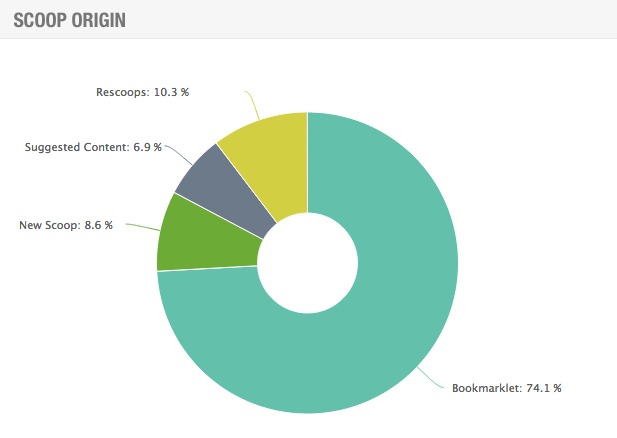
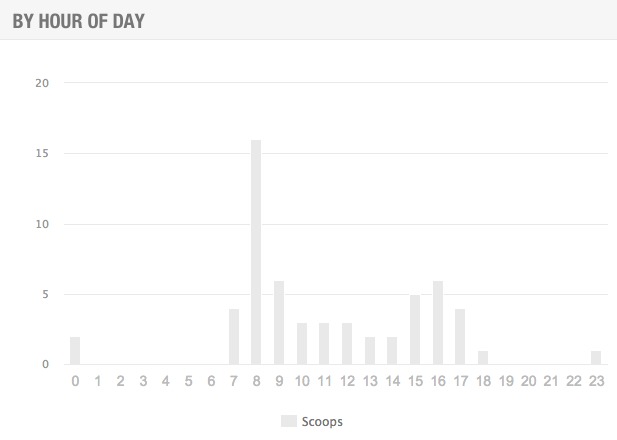
- Publishing behavior: analyze which types of content sources you’ve favored so far and what time of the day you post more often.
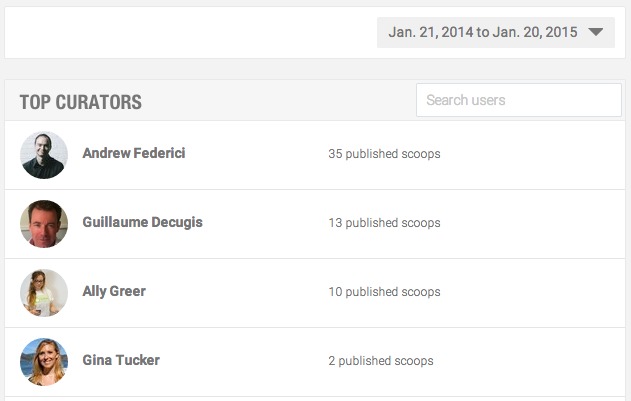
- Curators’ contributions: working as a team or with members of your community to maximize your content curation impact? Easily check who’s contributing the most overall and by topic
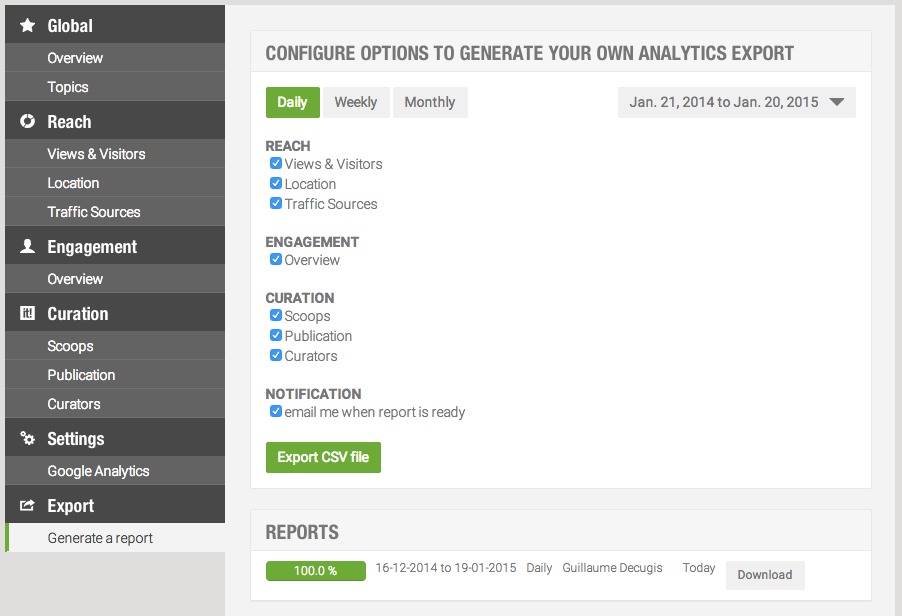
- Complete downloadable reports: need to export your analytics to Excel or your marketing dashboard? You can generate a report in just one click.
 In the next few days, we’ll talk more about how you can use the information from the new Scoop.it Analytics dashboard to evaluate your content marketing strategy and optimize it for success.
What would you like to hear more about? Let us know what data points you consider to be the most important and we’ll include them in our next post.
Want to work smarter and start generating real results from your content marketing? Find out how to use the new
Scoop.it Content Director to help you become a smarter marketer!

 (1 votes, average: 5.00 out of 5)
Hello
This looks great and they would be REALLY useful in the educational licenses- especially how various curators have performed. Hope you will consider adding this!
Anne Marie