
I have some bad news for you. Your “readers” aren’t reading much.
According to the globally-revered usability expert Jakob Nielsen, “On the average Web page, users have time to read at most 28% of the words during an average visit; 20% is more likely.”
If you graphed this situation, it’d look like this:
As you can see (rather than reading about it… ) engagement with the words on web pages is quite good – over 80% – if we keep the word count below 50.
That’s roughly enough words for a headline and a short description.
When we hit even 100 words, engagement with our text-based content drops to 70-60%.
This means you can expect most of the visitors to your content pages to read a headline, a short description of the content and maybe the first short introductory paragraph.
At 100-200 words, engagement with your copy falls down to about 40%. And by the time there are more than 200 words on a page, you’re getting roughly three out of ten people to read all of your content.
Or, in marketing-speak, you’re getting about 30% engagement.
Text isn’t always the best way to communicate
As marketers – and more specifically, as content creators – our job is to get the message through. It is to communicate our message to our audience.
If we’re getting only 30% engagement, most of our message is lost.
When we’re using computers, generally we communicate with words. But – as you know – we can communicate in many ways. If we could actually be in a room with our audience, we’d communicate through body language, our facial expressions, how we dress, the tone of our voice. There’d be a hundred tiny communication channels our audience would receive information through.
But alas, most of the time, we are not in a room with our audience. We have to work through the relatively dumbed-down communication channel of the internet.
This means we’re often limited to communicating through screens and keyboards.
But we also have images at our disposal. And it ends up that images can communicate a lot.
Here’s how to make them work for you, so your audience engages with far more than just 30% of your content.
1. Include an ATL tag.
What’s an ALT tag? It’s a little bit of text description you can add to your images. If you’re using WordPress, you can add ALT text to images in the image settings and controls – you don’t have to go in an edit HTML code to do this.
Not adding ALT tags is one of the most common SEO mistakes according to research from SEMRush. Nearly half of all websites are making this mistake.
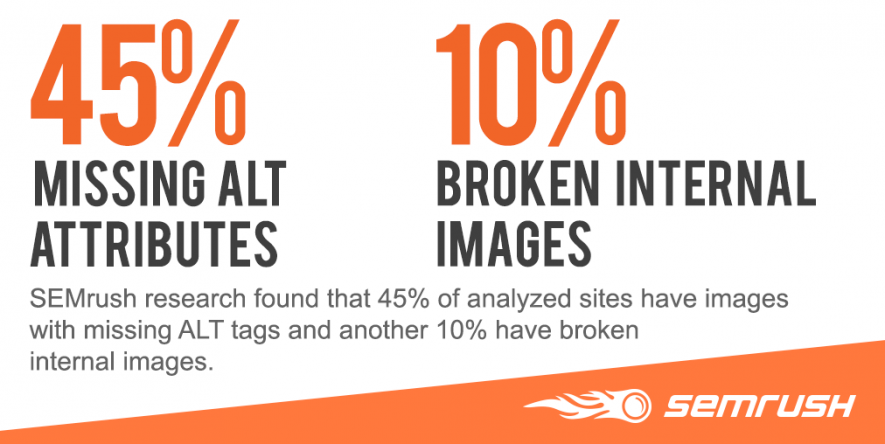
So why does this matter? Well, here are a few reasons:
- ALT tags tell search engines what your images are about. In other words (no pun intended), they’re a way to sneak in a few keywords – especially related keywords – into your pages.
- ALT tags will become the default image description on social media sites like Pinterest.
- If someone has the images turned off in their browser settings, or their connection is slow, they’ll see those ALT tags first.
- ALT tags will help your images show up in image search. More on that in a moment, but it’s actually a bigger deal than most people think.
2. Summarize your content’s main ideas into a micro image tutorial.
To do this, you’re going to need to distill your content’s message. Aim for something about the length of an elevator pitch. (Every piece of content should have an elevator pitch. Namely, a punchy, keyword-sprinkled meta description).
Here’s a great example of this from Socially Sorted.
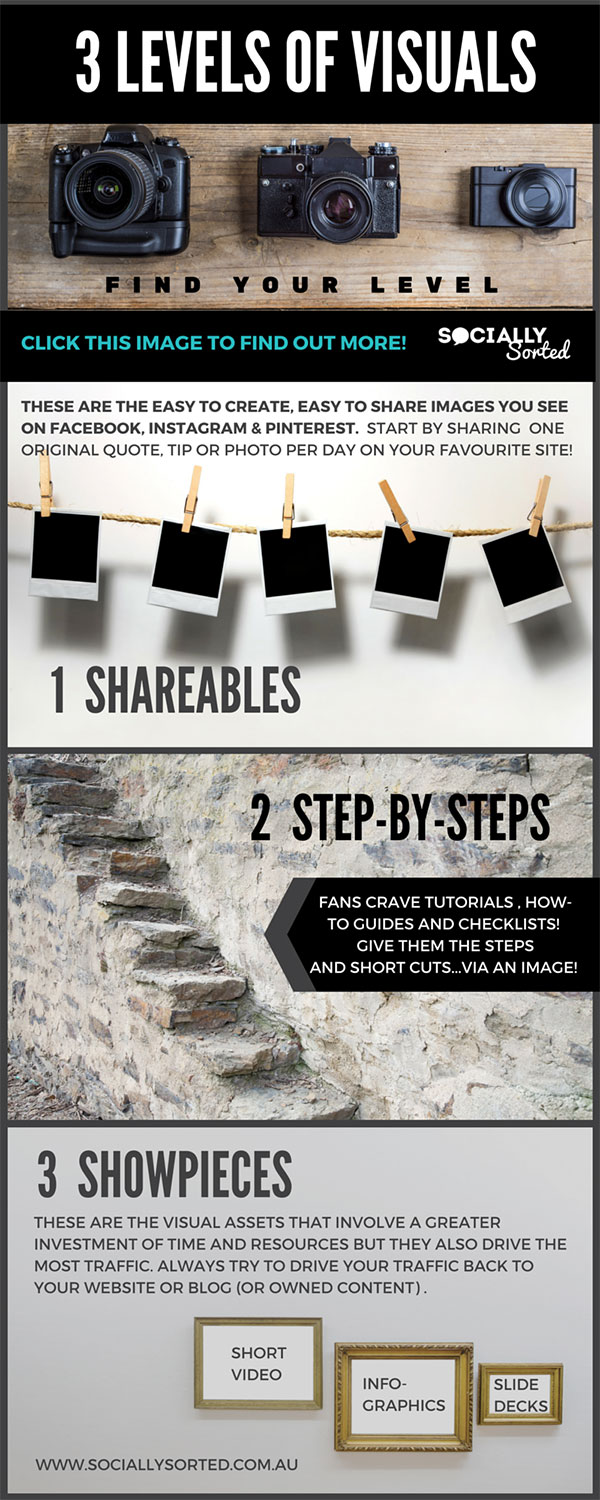
Also note the very clever “Click on this image to find out more”.
This item is made to be shared – and clicked.
Dan Zarrella’s research has found that adding “please retweet” to tweets gets them shared far more often. This probably applies to “please click”, too. (Somebody please do a test of this so we can know for sure.)
One really easy way to do this? Turn every statistic you cite into an attractive, shareable mini-infographic.
Think you can’t find the time to do this (or you hate playing around with pictures)? Then hire a freelancer on a place like Fiverr or upgrade and hire a service like Undullify or DesignPickle. For about $300 a month they’ll be your “in-house” designer without the in-house cost.
SEMRush has done an excellent job of breaking up a piece of content into individual, shareable images with their “11 Most Common On-Site SEO Mistakes” study and infographic. Their study (cited about in the point about ALT tags) was made into an infographic.
But they also broke up the infographic into smaller pieces. This makes citing and sharing their study much easier. It also gives the sharers and link creators highly relevant information.
3. Use photographs of actual employees and real customers.
Stock photos can be hard to resist. They’re almost instantly available. They look nice. You can find one that’s just right. They’re also really affordable – or even free.
But your visuals will have far more meaning and generate far better results if you start taking photos of the people who really run and interact with your business.
There’s even proof you’ll get higher conversions. A truck driving training company boosted conversions by 161% just by swapping a stock photo with a photo of one of their real students.
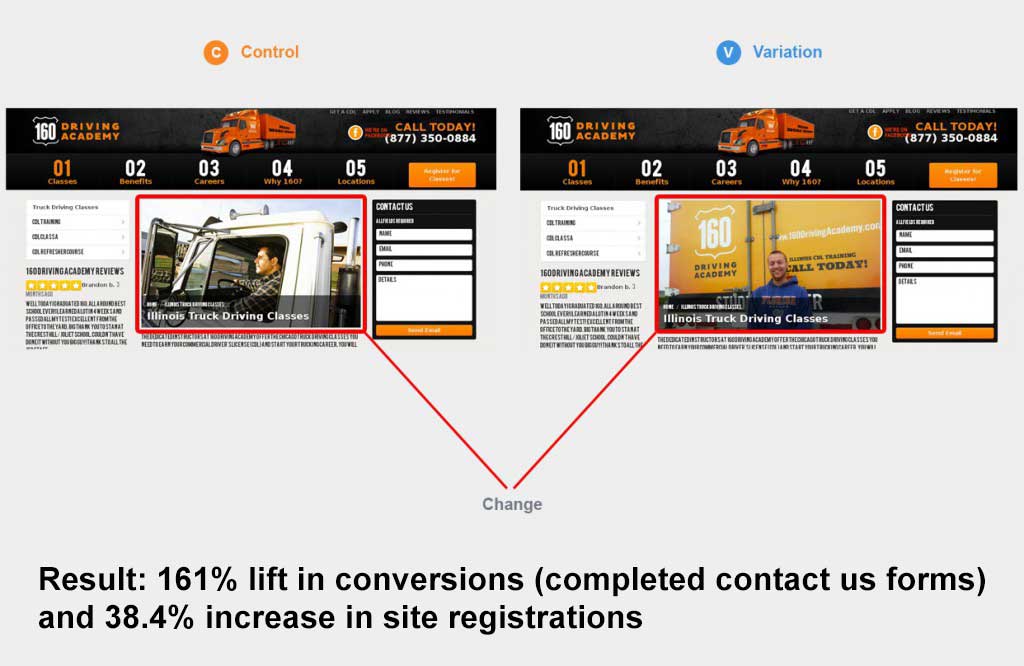
Notice something else really clever in the photo of the real student? He’s standing right next to a call to action. In fact, his head is blocking the “c” in “call today!”
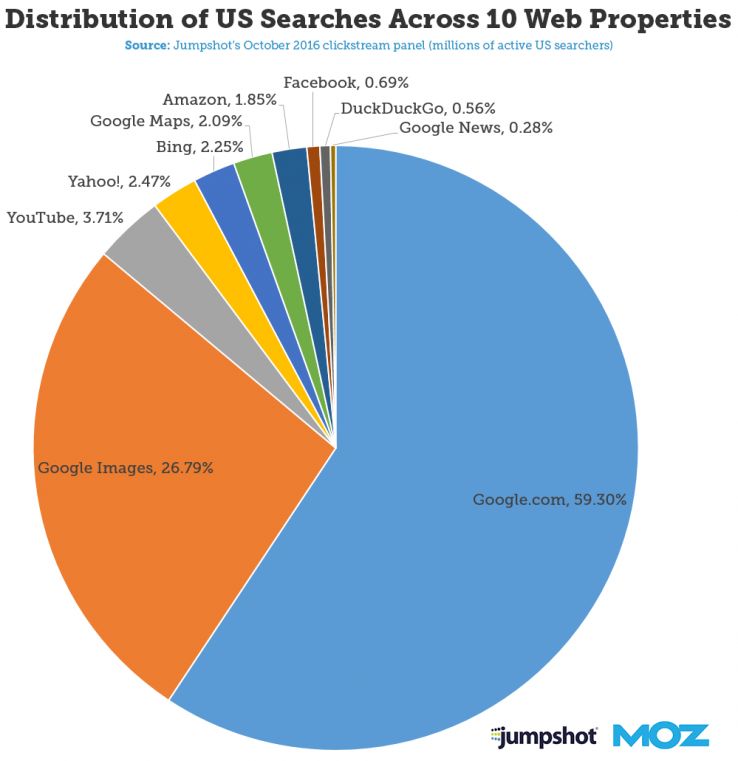
4. Optimize your images for image search
You know how much content has been created about ranking on Google.com, right? Libraries worth of content. Even the smaller topic of ranking on YouTube has at least a few bookshelves worth of content.
But image search? It’s being sorely neglected. That’s a gigantic missed opportunity, given that Google’s Image Search attracts almost half as many searches and Google.com.
To wit:
So… would you like to get in on some of this traffic? Stop ignoring your images. They need to be optimized accordingly:
- Include keywords in your image filenames
Don’t use too many keywords, but do better than “XL4345.jpg”, okay?
- Keep your image sizes as small as possible, while still making them look good
- Include ALT tags
See more about this earlier in this article.
- Include a title tag for your images
- Choose images that are relevant to the content around them
Relevancy is everything in SEO.
If you’d like a longer tutorial on how to get more traffic from Google Image Search, Rand Fishkin’s Whiteboard Friday on the topic is a must-watch.
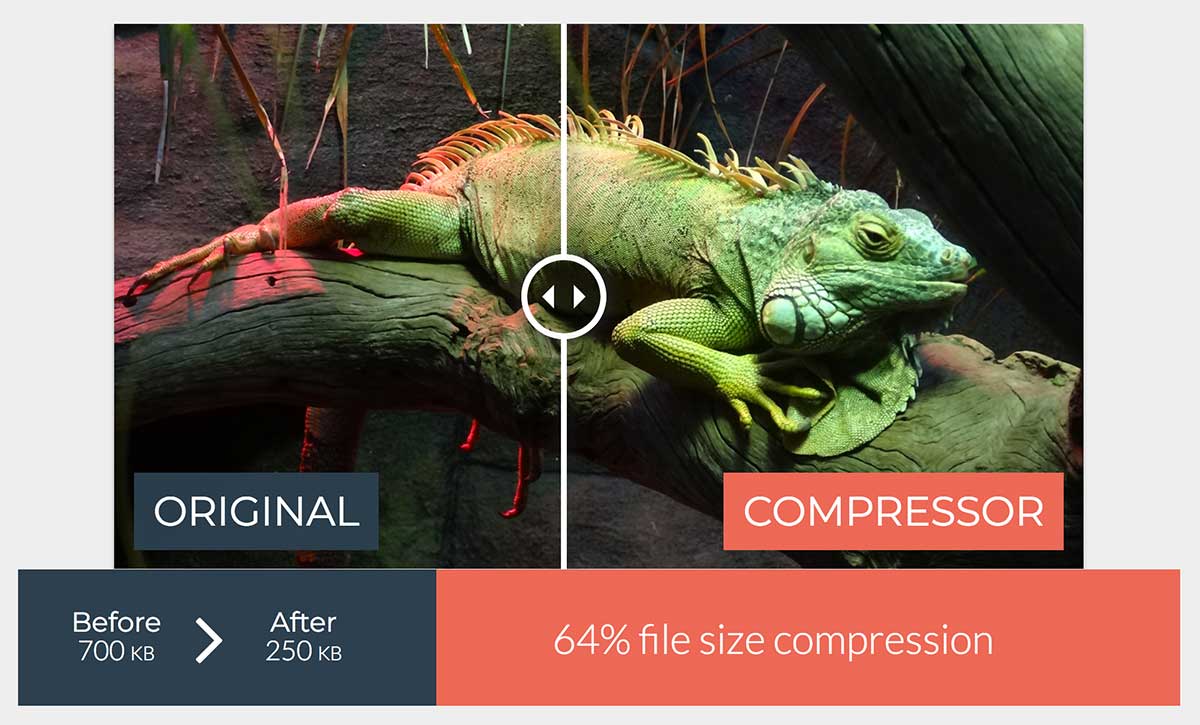
5. Keep image sizes as small as possible.
Speaking of search, you might also want to optimize your images so they load quickly. WordPress tools like “Lazy Load” can help with this, but the best place to start is to create images at the best size for your website’s page design. Then you can use image compression tools like Tiny PNG or Compressor.io to make them even smaller.
There are WordPress plugins that will do this for you, too. And creating svelte images is also a great way to help your email newsletters load quickly and get delivered more.
Closing thoughts
If you want to squeeze every possible bit of engagement from your audience, images are the way to go. Words still matter, but it’s time more content marketers developed the visual side of their content. If you’re not there yet, make it a priority for 2018.
Back to you
How do you get more engagement from the visual content you create? Leave a comment and share a tip or two.
And if you need help choosing the best software to skyrocket your content marketing results for 2017, download our free guide with over 44 tools reviewed!

 (3 votes, average: 5.00 out of 5)
Hey Pam, Great post, completely agree with you. Especially where you talked about Infographics. Infographics have been a great help to me for sharing information. Its easy to depict the data using images. Surely going to use these tips. Cheers.
-Shivangi, Marketing Head, RankWatch